
Widgets gallery#
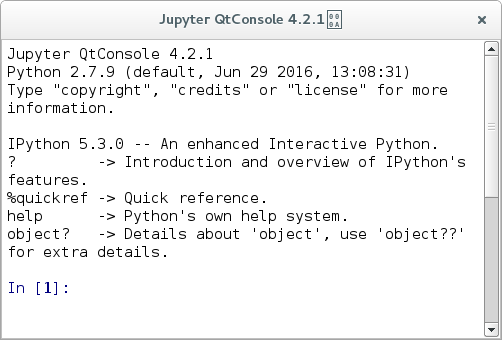
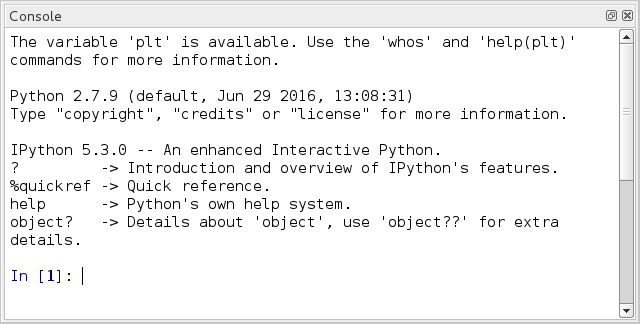
silx.gui.console Widgets#
Widget |
Description |
|---|---|
|
|
|
|
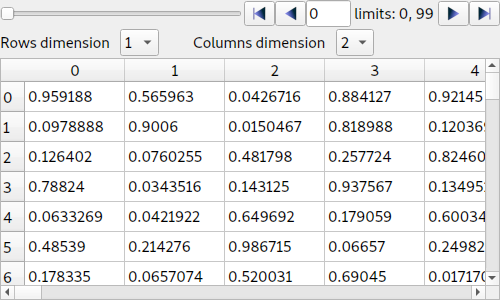
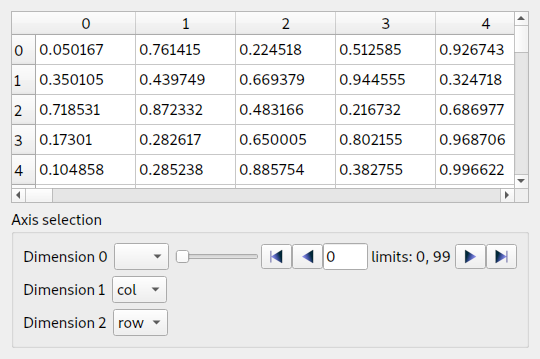
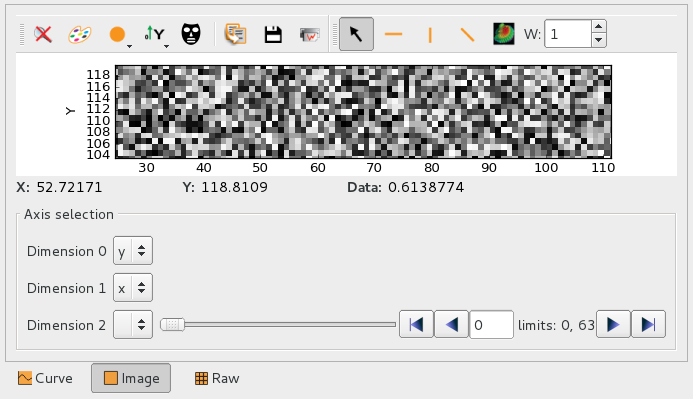
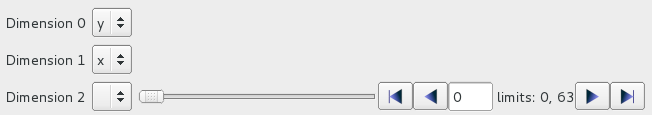
silx.gui.data Widgets#
Widget |
Description |
|---|---|
|
|
|
|
|
|
|
|
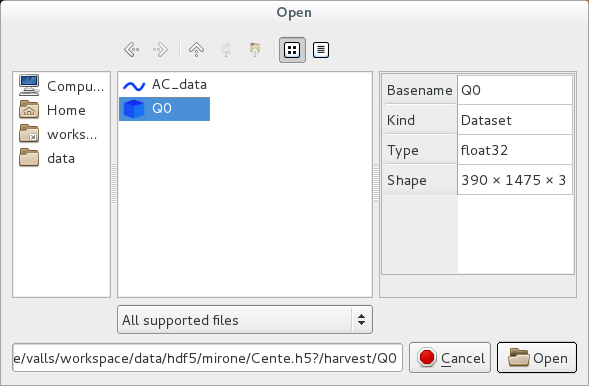
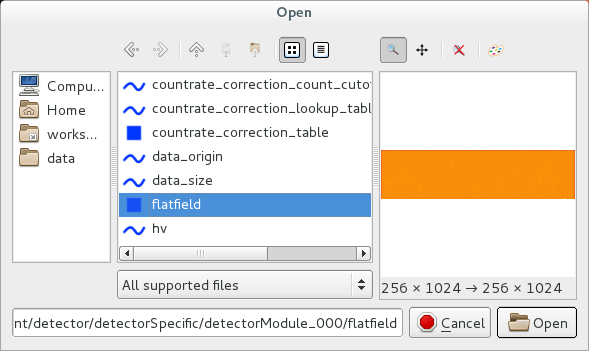
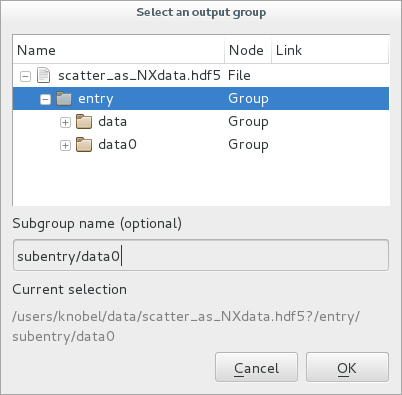
silx.gui.dialog Widgets#
Widget |
Description |
|---|---|
|
|
|
|
|
|
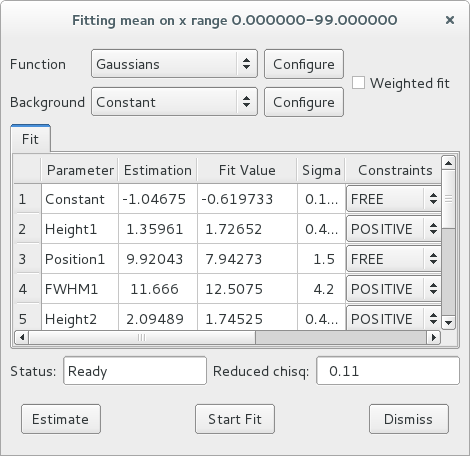
silx.gui.fit Widgets#
Widget |
Description |
|---|---|
|
|
|
|
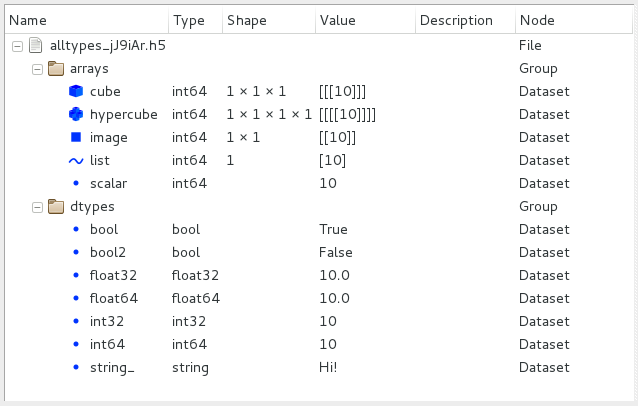
silx.gui.hdf5 Widgets#
Widget |
Description |
|---|---|
|
|
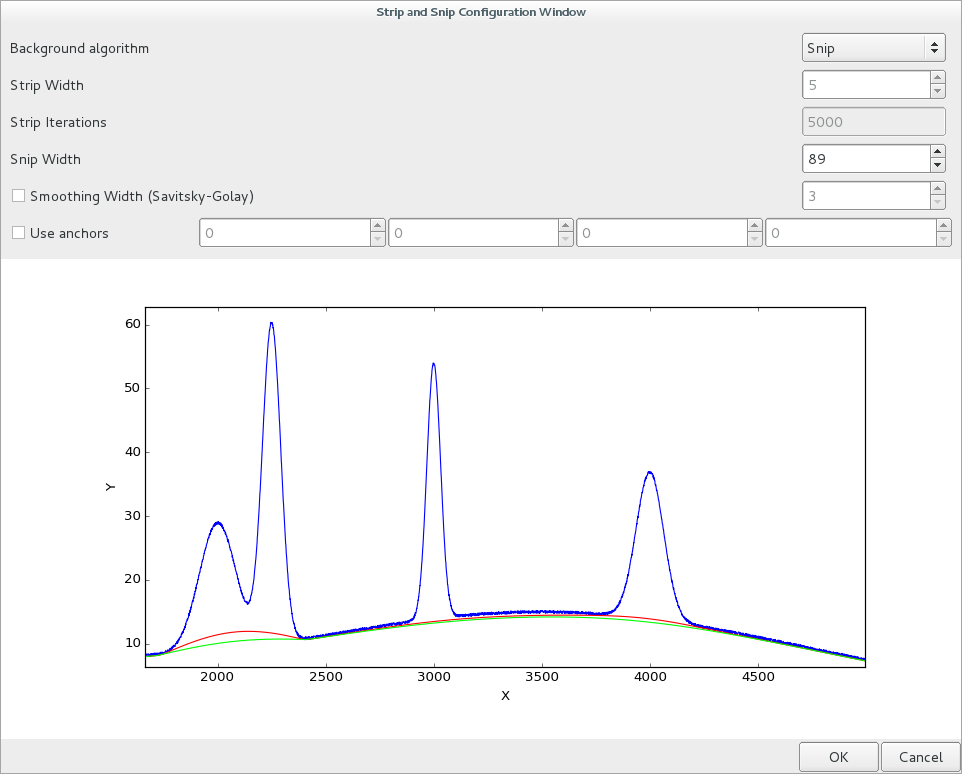
silx.gui.plot Widgets#
Plotting widgets:
Widget |
Description |
|---|---|
|
|
|
|
|
|
|
|
|
|
|
|
|
|
|
|
|
|
Additional widgets:
Widget |
Description |
|---|---|

|
|
|
|
|
|
|
|
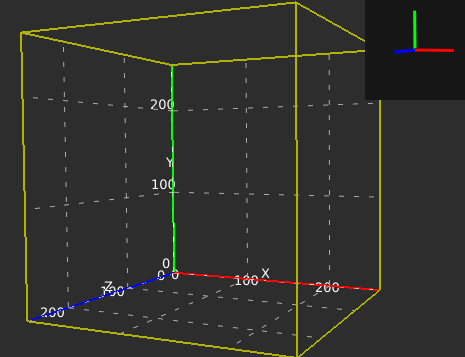
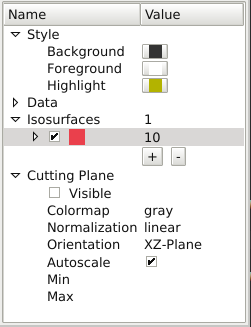
silx.gui.plot3d Widgets#
Widget |
Description |
|---|---|
|
|
|
|
|
|
|
|
|
|
|
|
Additional widgets:
Widget |
Description |
|---|---|

|
|
|
|
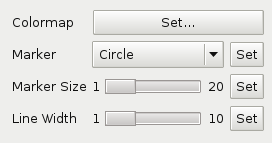
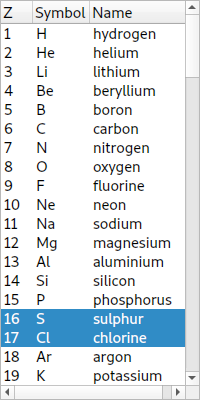
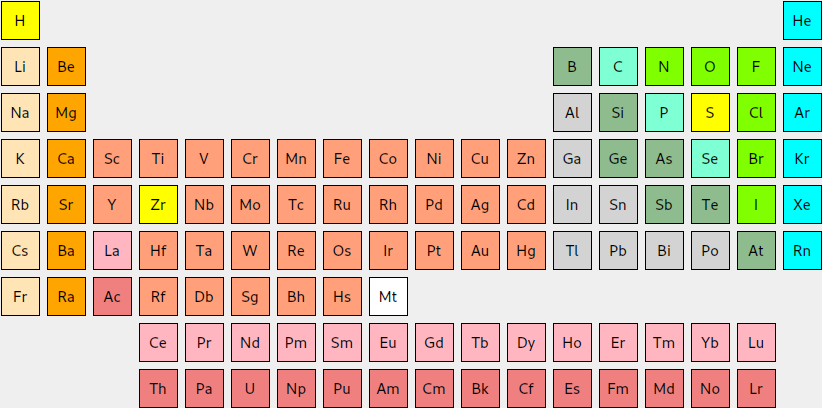
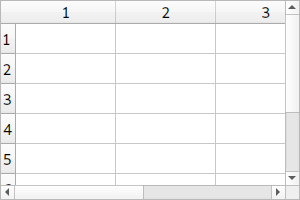
silx.gui.widgets Widgets#
Widget |
Description |
|---|---|

|
|

|
|

|
|

|
|
|
|
|
|
|
|

|
|

|
|