
ArrayTableWidget: Browsing Numpy arrays#
This module defines a widget designed to display data arrays with any number of dimensions as 2D frames (images, slices) in a table view. The dimensions not displayed in the table can be browsed using improved sliders.
The widget uses a TableView that relies on a custom abstract item
model: silx.gui.data.ArrayTableModel.
Widget#
- class ArrayTableWidget(parent=None)[source]#
This widget is designed to display data of 2D frames (images, slices) in a table view. The widget can load any n-dimensional array, and display any 2-D frame/slice in the array.
The index of the dimensions orthogonal to the displayed frame can be set interactively using a browser widget (sliders, buttons and text entries).
To set the data, use
setArrayData(). To select the perspective, usesetPerspective()or usesetFrameAxes(). To select the frame, usesetFrameIndex().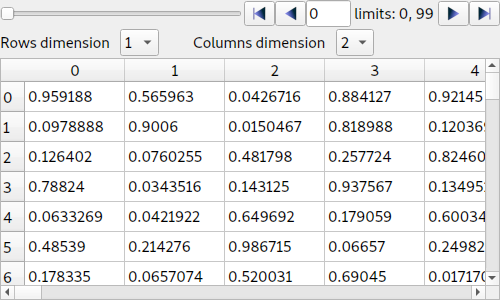
- setArrayData(data, labels=None, copy=True, editable=False)[source]#
Set the data array. Update frame browsers and labels.
- Parameters:
data – Numpy array or similar object (e.g. nested sequence, h5py dataset…)
labels – list of labels for each dimension of the array, or boolean
Trueto use default labels (“dimension 0”, “dimension 1”, …). None to disable labels (default).copy (bool) – If True, store a copy of data in the model. If False, store a reference to data if possible (only possible if data is a proper numpy array or an object that implements the same methods).
editable (bool) – Flag to enable editing data. Default is False
- setArrayColors(bgcolors=None, fgcolors=None)[source]#
Set the colors for all table cells by passing an array of RGB or RGBA values (integers between 0 and 255).
The shape of the colors array must be consistent with the data shape.
If the data array is n-dimensional, the colors array must be (n+1)-dimensional, with the first n-dimensions identical to the data array dimensions, and the last dimension length-3 (RGB) or length-4 (RGBA).
- Parameters:
bgcolors – RGB or RGBA colors array, defining the background color for each cell in the table.
fgcolors – RGB or RGBA colors array, defining the foreground color (text color) for each cell in the table.
- displayAxesSelector(isVisible)[source]#
Allow to display or hide the axes selector.
- Parameters:
isVisible (bool) – True to display the axes selector.
- setFrameIndex(index)[source]#
Set the active slice/image index in the n-dimensional array.
A frame is a 2D array extracted from an array. This frame is necessarily parallel to 2 axes, and orthogonal to all other axes.
The index of a frame is a sequence of indices along the orthogonal axes, where the frame intersects the respective axis. The indices are listed in the same order as the corresponding dimensions of the data array.
For example, it the data array has 5 dimensions, and we are considering frames whose parallel axes are the 2nd and 4th dimensions of the array, the frame index will be a sequence of length 3 corresponding to the indices where the frame intersects the 1st, 3rd and 5th axes.
- Parameters:
index – Sequence of indices defining the active data slice in a n-dimensional array. The sequence length is \(n-2\)
- Raise:
IndexError if any index in the index sequence is out of bound on its respective axis.
- setPerspective(perspective)[source]#
Set the perspective by specifying which axes are orthogonal to the frame.
For the opposite approach (defining parallel axes), use
setFrameAxes()instead.- Parameters:
perspective – Sequence of unique axes numbers (0-based) defining the orthogonal axes. For a n-dimensional array, the sequence length is \(n-2\). The order is of the sequence is not taken into account (the dimensions are displayed in increasing order in the widget).
- setFrameAxes(row_axis, col_axis)[source]#
Set the perspective by specifying which axes are parallel to the frame.
For the opposite approach (defining orthogonal axes), use
setPerspective()instead.- Parameters:
row_axis (int) – Index (0-based) of the first dimension used as a frame axis
col_axis (int) – Index (0-based) of the 2nd dimension used as a frame axis
- getData(copy=True)[source]#
Return a copy of the data array, or a reference to it if copy=False is passed as parameter.
- Parameters:
copy (bool) – If True (default), return a copy of the data. If False, return a reference.
- Returns:
Numpy array of data, or reference to original data object if copy=False
Data model#
This module defines a data model for displaying and editing arrays of any number of dimensions in a table view.
- class ArrayTableModel(parent=None, data=None, perspective=None)[source]#
This data model provides access to 2D slices in a N-dimensional array.
A slice for a 3-D array is characterized by a perspective (the number of the axis orthogonal to the slice) and an index at which the slice intersects the orthogonal axis.
In the n-D case, only slices parallel to the last two axes are handled. A slice is therefore characterized by a list of indices locating the slice on all the \(n - 2\) orthogonal axes.
- Parameters:
parent – Parent QObject
data – Numpy array, or object implementing a similar interface (e.g. h5py dataset)
fmt (str) – Format string for representing numerical values. Default is
"%g".perspective (sequence[int]) – See documentation of
setPerspective().