Exercise: HPLC experiment
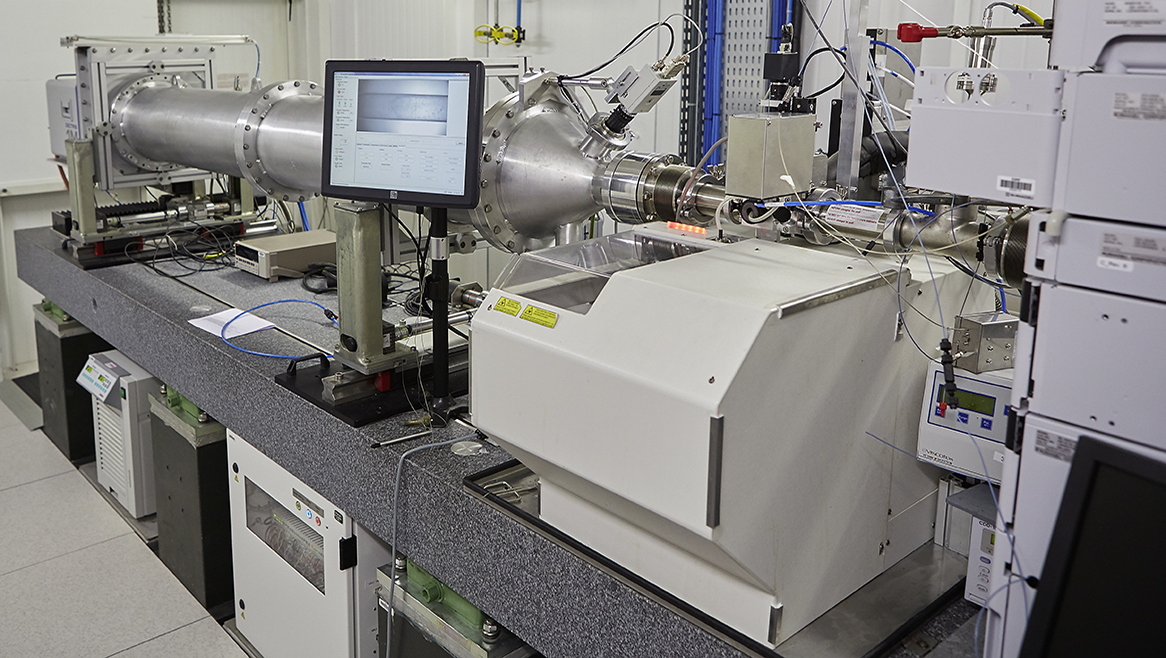
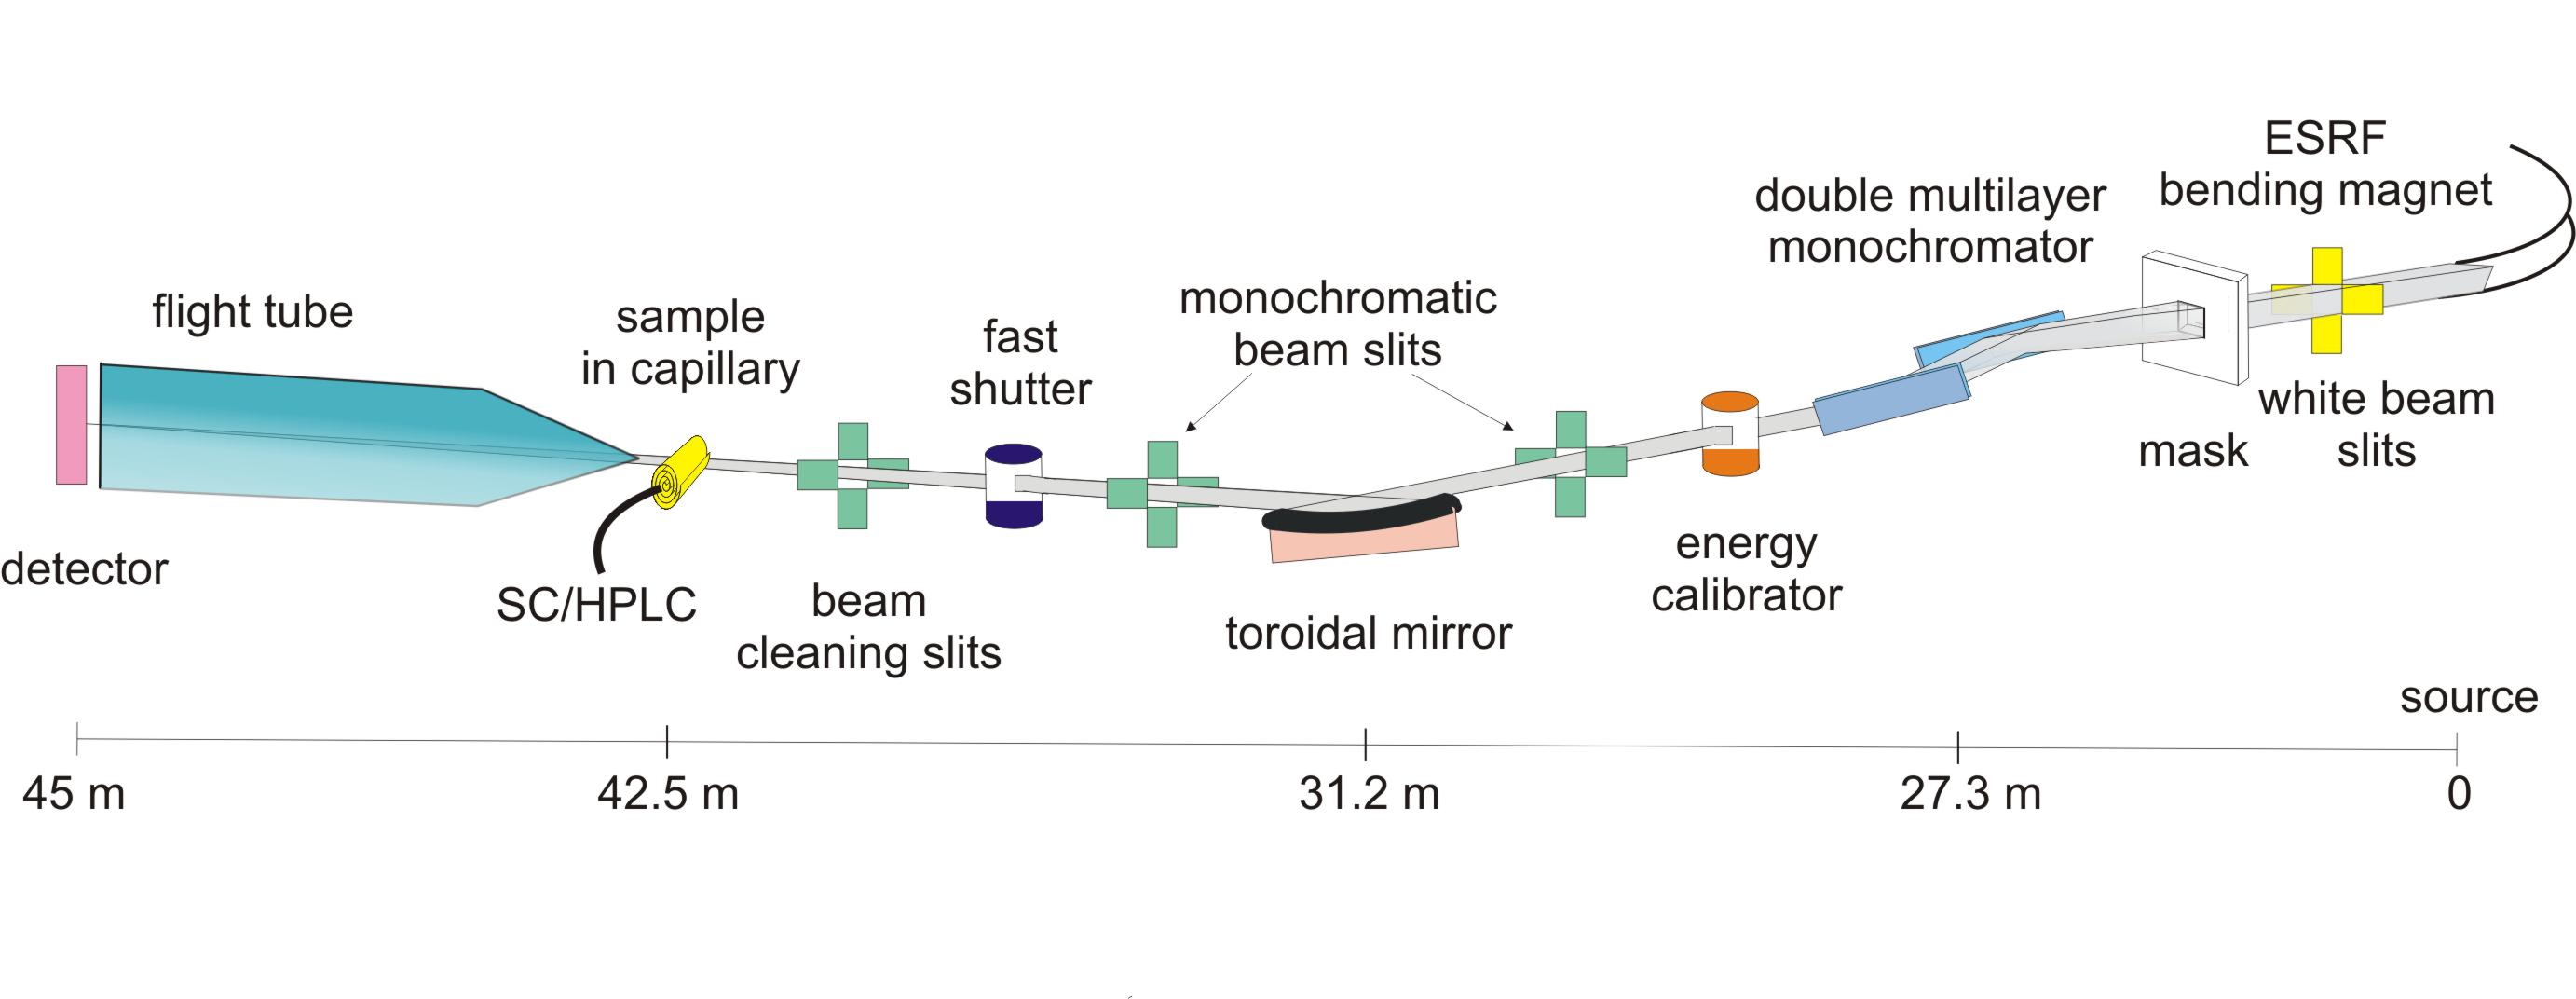
Credits ESRF/BM29 beamline
Introduction
Process data from a High-performance Liquid Chromatography (HPLC) experiment performed on ESRF/BM29 BioSAXS beamline.
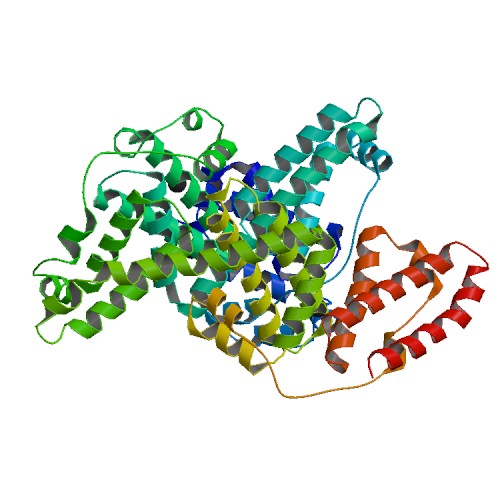
The sample is Bovin Serum Albumin (BSA) protein (used as a standard sample):
The buffer and sample are exposed to X-rays while passing through a capillary. Images are recorded over time (400 in this experiment) and an azimuthal integration is performed for each image with pyFAI.
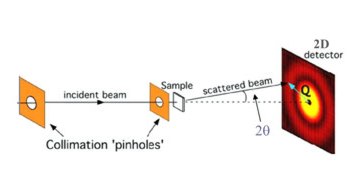
This results in 400 curves of integrated intensities I for 1000 values of q.
Those I values are stored as a 2D dataset of shape (400, 1000) in the intensities.npy file.
The q values are stored in the q.txt file.
At first, only the buffer is passing through the capillary, then sample + buffer and finally buffer again.
The goal is to extract the intensity contributed by the sample. The steps are:
- Separate integrated intensities corresponding to buffer+sample from those corresponding to buffer only
- Estimate the buffer and the sample + buffer intensities by averaging the selected integrated intensities
- Remove the buffer background from sample + buffer
Part I
import numpy as np
Load data
Load intensities I from the intensities.npy file and q values from the q.txt file.
intensities = # TODO
q = # TODO
Plot data
%matplotlib widget
# This requires ipympl
# Or for non-interactive plots: %matplotlib inline

from matplotlib import pyplot as plt
# Plot the intensities
import matplotlib.colors as colors

fig = plt.figure()
plt.imshow(intensities, norm=colors.LogNorm(), aspect="auto")

# Note: with latest version of matplotlib:
# plt.imshow(intensities, norm="log", aspect="auto")
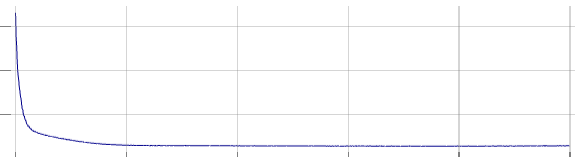
# Plot one curve
fig = plt.figure()
plt.plot(q, intensities[0])
plt.yscale("log")  # Use logarithmic scale for y axis
Part II
Average of all azimuthal integrations
Compute the averaged intensity over intensities for each value of q
intensities_mean = # TODO
fig = plt.figure()
plt.plot(q, intensities_mean)
plt.xlabel("q")
plt.ylabel("I")
plt.yscale("log")
plt.title("Average intensity")  # Add a title to the plot
Note: This is not meaningful, the buffer and sample + buffer cases should be separated.
Summed intensity of each azimuthal integration
Compute the sum of each row of the intensities data
intensities_per_frame = # TODO
fig = plt.figure()
plt.plot(intensities_per_frame)
plt.xlabel("Frame ID")
plt.ylabel("I")
Part III
Separate sample + buffer from buffer only
Select buffer and sample + buffer intensities by using a threshold over intensities_per_frame.
buffer = # TODO
sample_buffer = # TODO
print("buffer shape:", buffer.shape, "sample_buffer shape:", sample_buffer.shape)
Average sample + buffer and buffer intensities
Compute the average of azimuthal integrations of buffer for each q.
buffer_mean = # TODO
Do the same for sample_buffer.
sample_buffer_mean = # TODO
fig = plt.figure()
plt.plot(q, buffer_mean, 'black', q, sample_buffer_mean, 'red')
plt.title("buffer and sample + buffer average")
plt.xlabel("q")
plt.ylabel("I")
plt.yscale("log")
Remove buffer background
Compute the different between sample_buffer_mean and buffer_mean.
sample = # TODO
fig = plt.figure()
plt.plot(q, sample)
plt.yscale("log")
Solution
...
# Part I

import numpy as np

# Load data
intensities = np.load("intensities.npy")
q = np.loadtxt("q.txt")

# Part II

# Average of all azimuthal integrations
intensities_mean = np.mean(intensities, axis=0)

# Summed intensity of each azimuthal integration
intensities_per_frame = np.sum(intensities, axis=1)

# Part III

# Separate sample + buffer from buffer only
# 1. with thresholds
buffer_mask = intensities_per_frame < 32500
buffer = intensities[buffer_mask]
sample_buffer_mask = frames_intensities > 33000
sample_buffer = intensities[sample_buffer_mask]
# 2. With slicing
buffer = intensities[:200]
sample_buffer = intensities[270:340]

# Average sample + buffer and buffer intensities
buffer_mean = np.mean(buffer, axis=0)
sample_buffer_mean = np.mean(sample_buffer, axis=0)

# Remove buffer background
sample = sample_buffer_mean - buffer_mean